Students examine how information changes over time in order to determine the values, perspectives, and processes that shape it.

Discussion Prompts
- A lot of research – particularly scientific research – simply cannot be conducted without adequate funding from organizations like the National Institutes of Health. Read After Congressional Green Light, Scientists Begin Hemp Studies, and take a look at Why Can’t the U.S. Treat Gun Violence as a Public-Health Problem? Discuss the ways in which both funding and government permission can influence what gets researched and what does not. How might social, cultural, and historical context affect what type of information is created – and thus what people know – over time?
- Even when research is funded, it doesn’t always make it into “The Literature.” Ask students to read Trial sans Error: How Pharma-Funded Research Cherry-Picks Positive Results [Excerpt] and discuss how this plays out in the medical field. For a shorter read, see What the Industry Knew About Sugar’s Health Effects, But Didn’t Tell Us. Consider pairing these readings with Why a Lot of Important Research Is Not Being Done.
- Scientific findings don’t always get translated accurately by popular media outlets. Check out this “Scientific Studies” segment from Last Week Tonight with John Oliver for a comedic rundown of how what we see in the news is often exaggerated, misinterpreted, or just plain false.
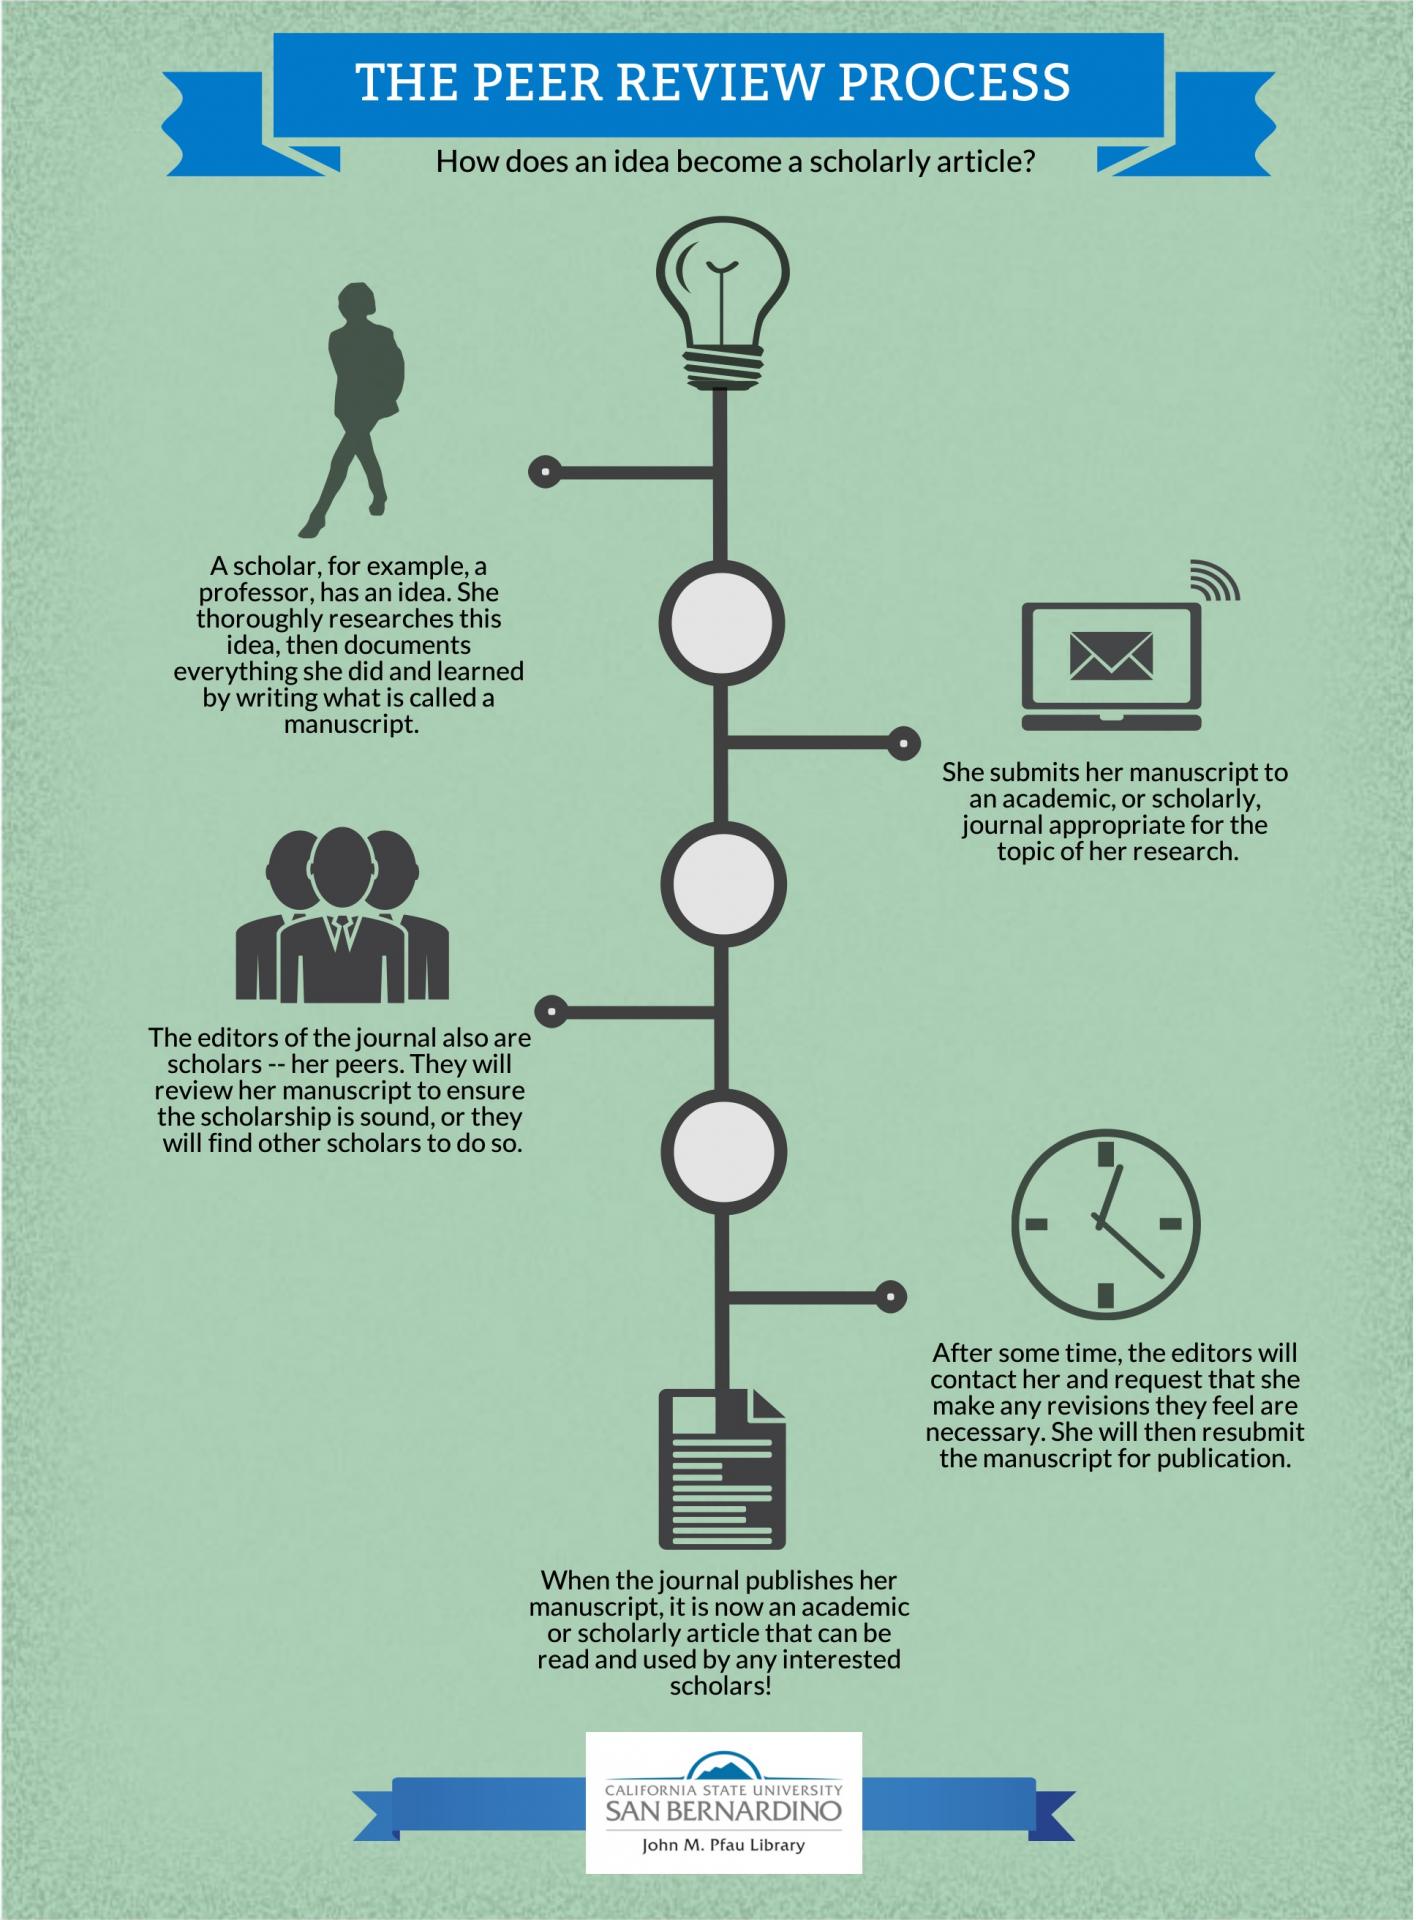
- Peer review is the formal process scholarly journals employ to ensure that a manuscript’s writing, methodology, arguments, and conclusions are sound. Peer review has long been a marker of quality that sets scholarly articles apart from popular articles. However, peer review can be a flawed process.
- In Thinking through Visualizations: Critical Data Literacy Using Remittances, Pappas, Emmelhainz, and Seale suggest asking students to interrogate World Bank data through the following questions (p. 185):
- Where did this data come from?
- How was it collected?
- What other agencies collect data on this topic?
- What demographic categories are included in this data (e.g. age, gender, occupation)?
- What useful categories are missing?
- What is the time period under consideration?
- What does the visualization suggest about the data?
- What are the main trends it shows?
- How does it explain or not explain those trends?
- Can you think of ways this data might be used in real life?
For more examples of how to stretch students’ understanding of data and visualizations, see Teaching with Data: Visualization and Information as a Critical Process
Class Activities
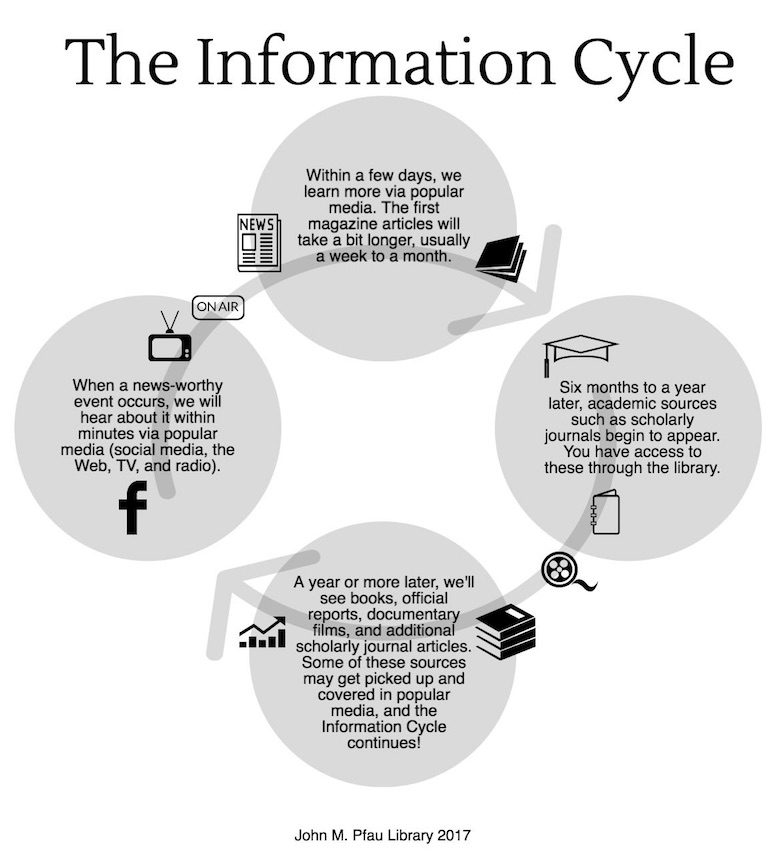
- Pick an event that occurred at least one year ago (e.g., the Flint Michigan water crisis). Students should be familiar with the event, but it should not be so recent that scholarly sources have not yet addressed it. Split students into group of three or four, and provide each group with one source that addresses the event. Each group should be given a source that was created at a different moment following the event. Sources might include:
- Tweet or Facebook post
- Newspaper or magazine article
- News broadcast
- Scholarly journal article
- Scholarly book
- Popular book
- Documentary film
Student groups ought to then consider the values, perspectives, and processes (e.g., the lack of editorial process for Tweets or the peer review process for a scholarly journal article) that shaped their information source. Groups then share their findings with the whole group – consider asking students to use the information cycle graphic (below) to capture the conversation that follows. Following presentations, the whole group ought to reflect upon the ways in which the discourse surrounding the event has changed over time.
- Read Google Search: Hyper-visibility as a Means of Rendering Black Women and Girls Invisible, Technology is Biased Too. How Do We Fix It?, Commercial Content Moderation: Digital Laborers’ Dirty Work, and then watch How I’m Fighting Bias in Algorithms or Beware online “filter bubbles.” Write a reflective essay putting these pieces in conversation with one another. What’s going on behind the scenes? Consider what content you are not seeing online. How does social and historical context affect what we know and what’s done with information?
- In Of the People, by the People, for the People: Critical Pedagogy and Government Information ( chapter 13 here), Maskin encourages instructors to contextualize government publications for students, illustrating how this type of information is political. She recommends asking students to explore the U.S. Department of State’s Country Reports on Human Rights Practices, and then look at China’s rebuttal that addresses human rights in the U.S. Ask students to work in small groups to explore “when a document was produced and by whom, the document’s intended audience, what purposes the document might serve, and what it tells us about ideas of human rights at that place and time” (p. 123). See the full chapter for more ideas about how to work with students to illuminate the various factors that shape government information.
Did You Know?
- Just because something was published in a scholarly journal doesn’t necessarily mean it is right, correct, or true. Unfortunately, scholarly journals sometimes retract articles they publish after later finding that an article’s methodology or conclusions were erroneous, fraudulent, etc. Check out the links below for recent examples.
Pfau Library Videos
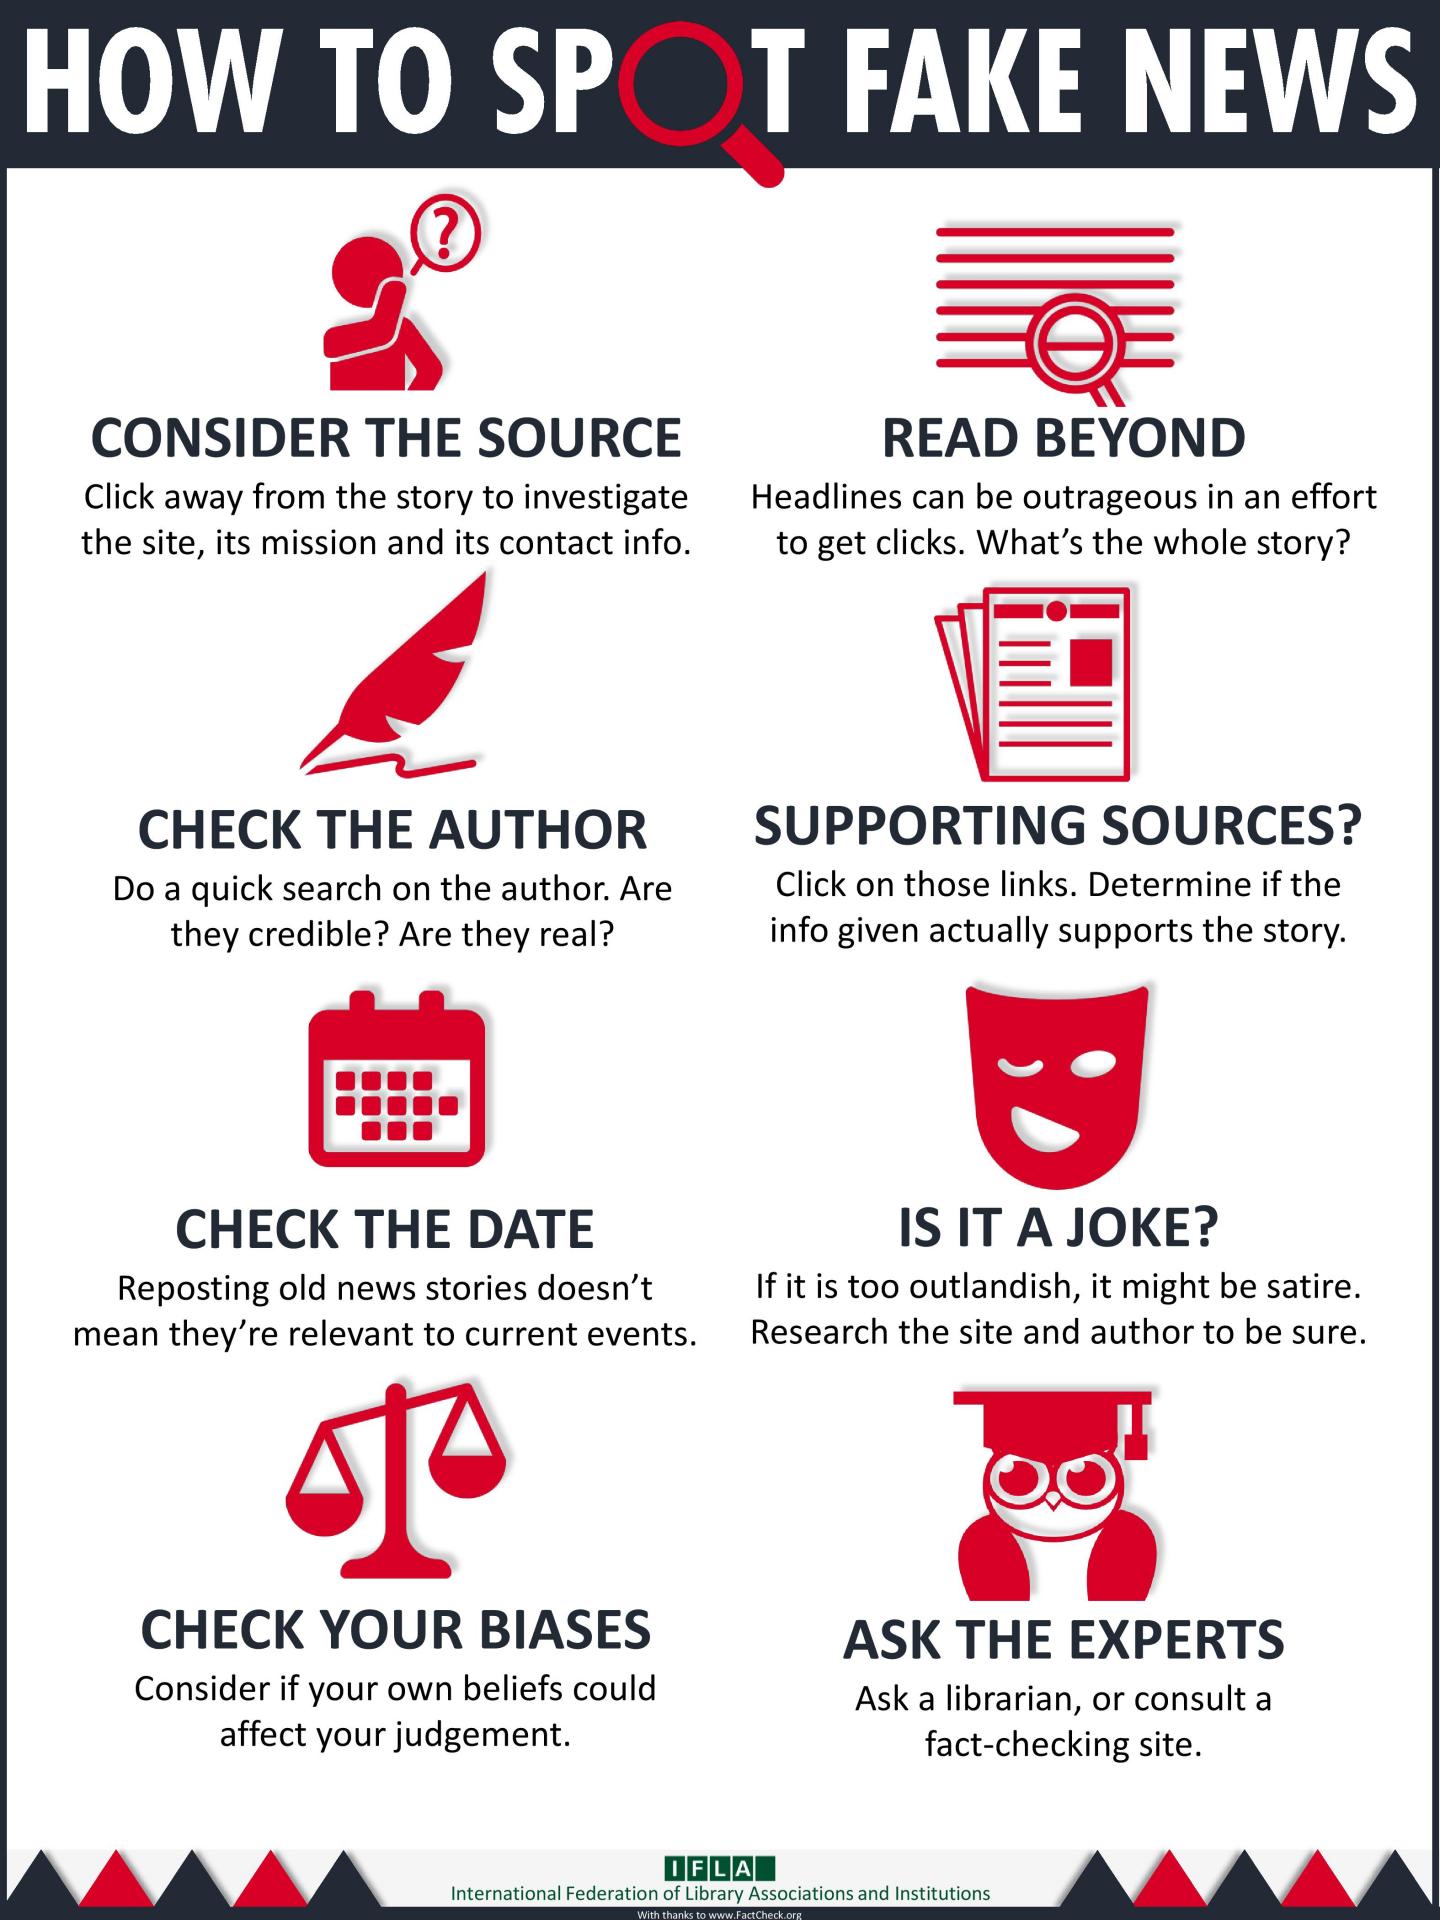
LibGuide: Fake News & Fact Checking
TedEd video: How to Spot a Misleading Graph
Open Access E-book: Journalism, ‘Fake News’ and Disinformation: A Handbook for Journalism Education and Training
LibGuide: Publishing a Scholarly Article
Science Information Life Cycle – University of California Irvine (CC-NC-SA 3.0)
Check out the discussion prompts and activities for SLO 3: Popular and Scholarly Sources
Last updated 2018


