STUDENT ENROLLMENT
TOTAL ENROLLMENT
At California State University, San Bernardino (CSUSB) and its Jack H. Brown College (JHBC), the enrollment trends from 2018 through 2023 show various patterns as well as the impact of external factors such as the COVID-19 pandemic. At CSUSB, undergraduate enrollments showed a marked decrease from 5,100 students in 2018 to 4,166 in 2023, a reduction of nearly 18.3%. Graduate enrollments, however, presented a different picture, fluctuating over the years but ultimately increasing from 605 students in 2018 to 832 by 2023, reflecting a growth of 37.5%.
The COVID-19 pandemic, in particular, appears to have significantly influenced undergraduate enrollment trends around 2020 and 2021. During this period, undergraduate enrollment at CSUSB dropped sharply by about 7.3% from 5,157 students in 2020 to 4,779 in 2021. In contrast, graduate enrollment during the same timeframe saw an increase. This potentially suggests a shift towards further education during challenging time.
Within the college, the enrollment trajectory was somewhat steadier yet still showed a decline. Undergraduate enrollments decreased from 917 students in 2018 to 798 in 2023, representing a decline of approximately 13%. Graduate enrollments at the JHBC has decreased from 199 students in 2018 to a low of 165 in 2022, before recovering slightly. In 2023, JHBC enrolled 191 students, a decrease of about 3.5%.
The numbers show that JHBC undergraduate population is decreasing faster that the similar population with in the University. The numbers also indicate that JHBC graduate population is shrinking while it is increasing at the university level.
ENROLLMENT BY GENDER
Undergraduate Enrollment
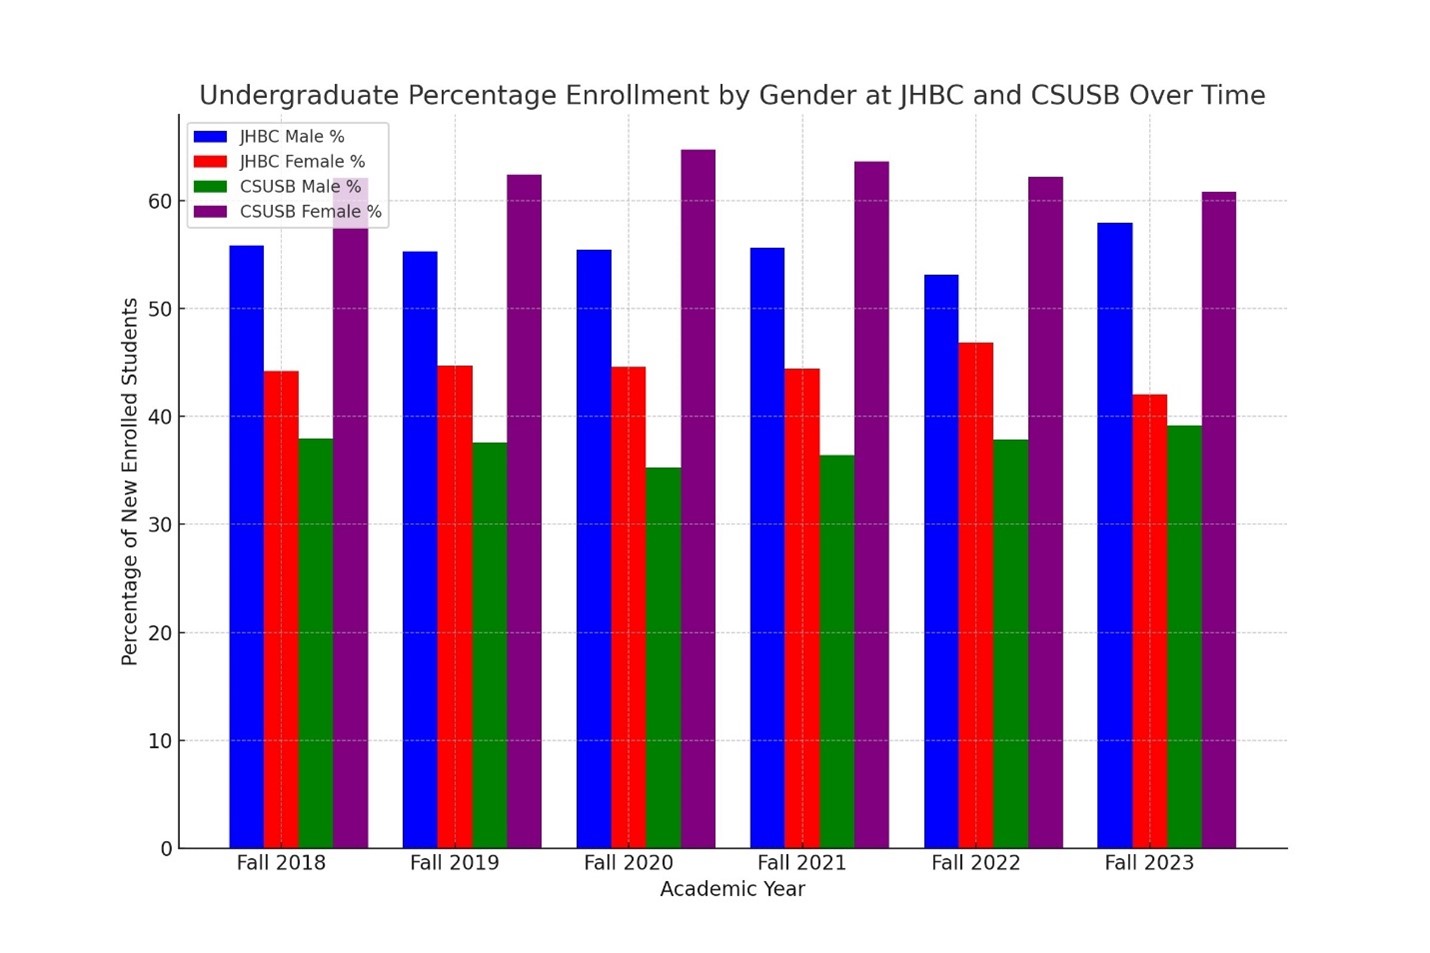
Data shows that in JHBC, male enrollment consistently exceeds females enrollment; with the highest enrollment occurring in Fall 2023 at 60.27% and the lowest in Fall 2020 at 56.97%. On the contrary, at CSUSB, the percentages of female students significantly outnumber the percentages of male students. Within the university, females consistently account for more than 61% of the undergraduate population.
Comparatively, the national average for undergraduate gender distribution typically shows a more balanced ratio. According to the National Center for Education Statistics (NCES, 2021; NCES, 2022), females generally comprise about 56% of the undergraduate population across various institutions, suggesting that CSUSB aligns with broader trends. Data from the Association to Advance Collegiate Schools of Business (AACSB) indicates that the average male-to-female ratio tends to be more balanced, often around a 50-50 split (AACSB, 2021, 2023). This contrasts sharply with the trends observed at JHBC, suggesting potential areas for strategic recruitment adjustments.
Graduate Enrollment
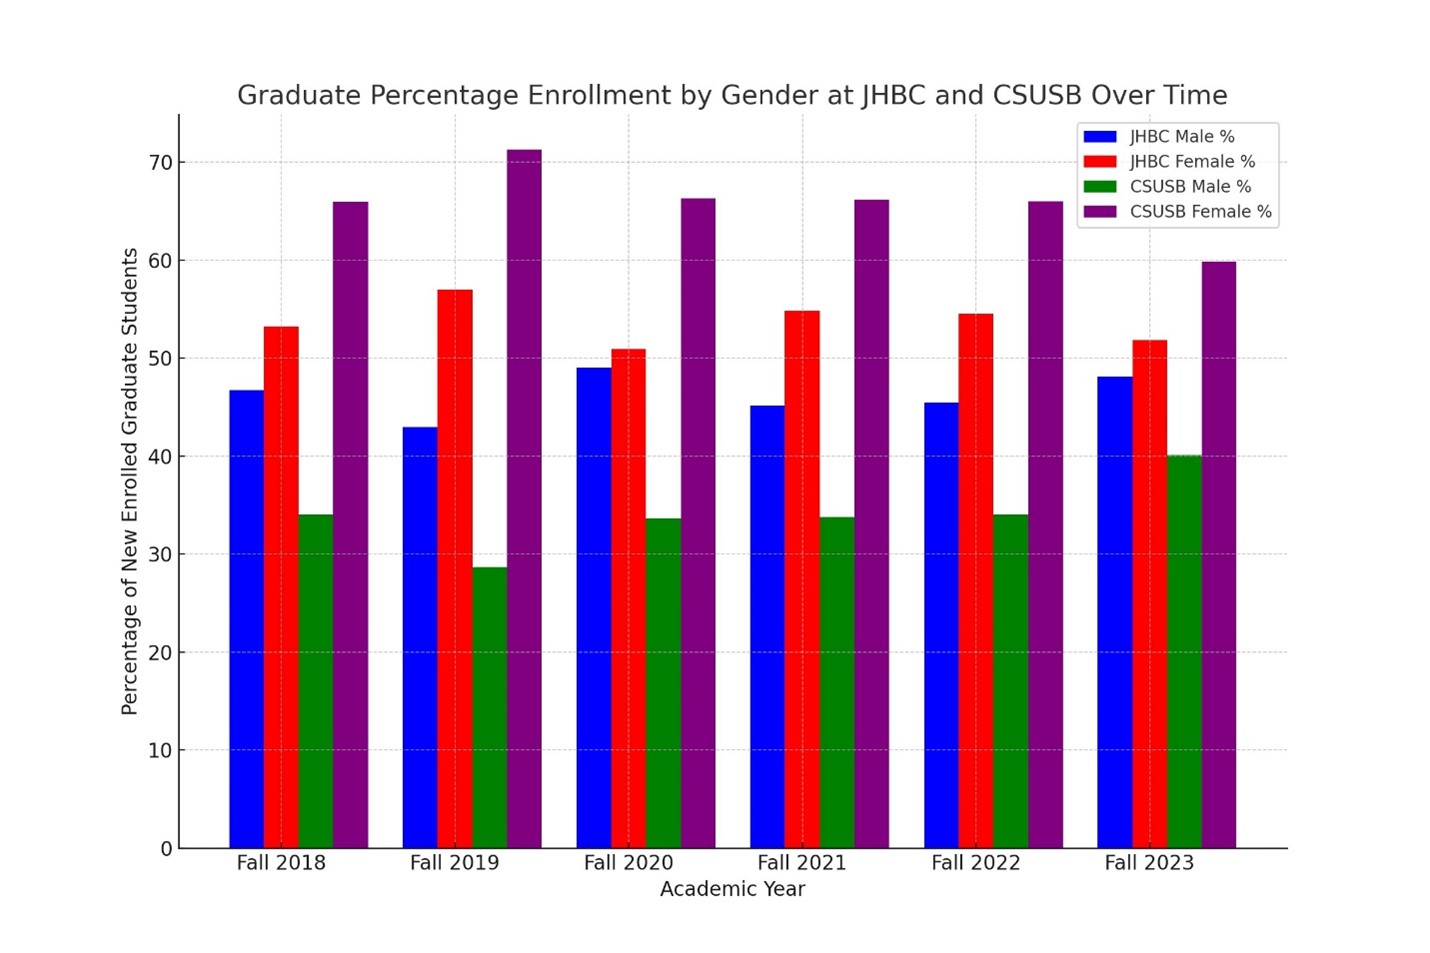
The gender distribution among JHBC's graduate students is more balanced than in its undergraduate programs. Male enrollment ranges from 43.0% in Fall 2019 to 48.16% in Fall 2023, with females typically constituting just over half of the enrollment. At CSUSB the distribution continues to see female dominance in graduate enrollment, although the percentages are slightly lower than those seen at the undergraduate level. Women consistently make up more than 65% of the graduate student body, except in Fall 2023, where it dropped slightly to 59.86%.
Regarding the national average for graduate enrollment by gender, the landscape appears somewhat balanced but shows variation depending on the field of study. In recent data covering U.S. graduate programs, women comprised 58% of master’s and graduate certificate students and about 56.3% of doctoral students. This suggests that, like CSUSB, many institutions see a higher proportion of females in graduate enrollment compared to males, though the percentages might vary across different types of institutions and fields of study (Council of Graduate Schools, 2023.
For gender distribution among graduate students in AACSB-accredited business schools, recent data shows a move towards greater gender parity. Specifically, business schools have seen an almost even gender distribution in some programs (AACSB, 2022).
ENROLLMENT BY ETHNICITY
Undergraduate Enrollment
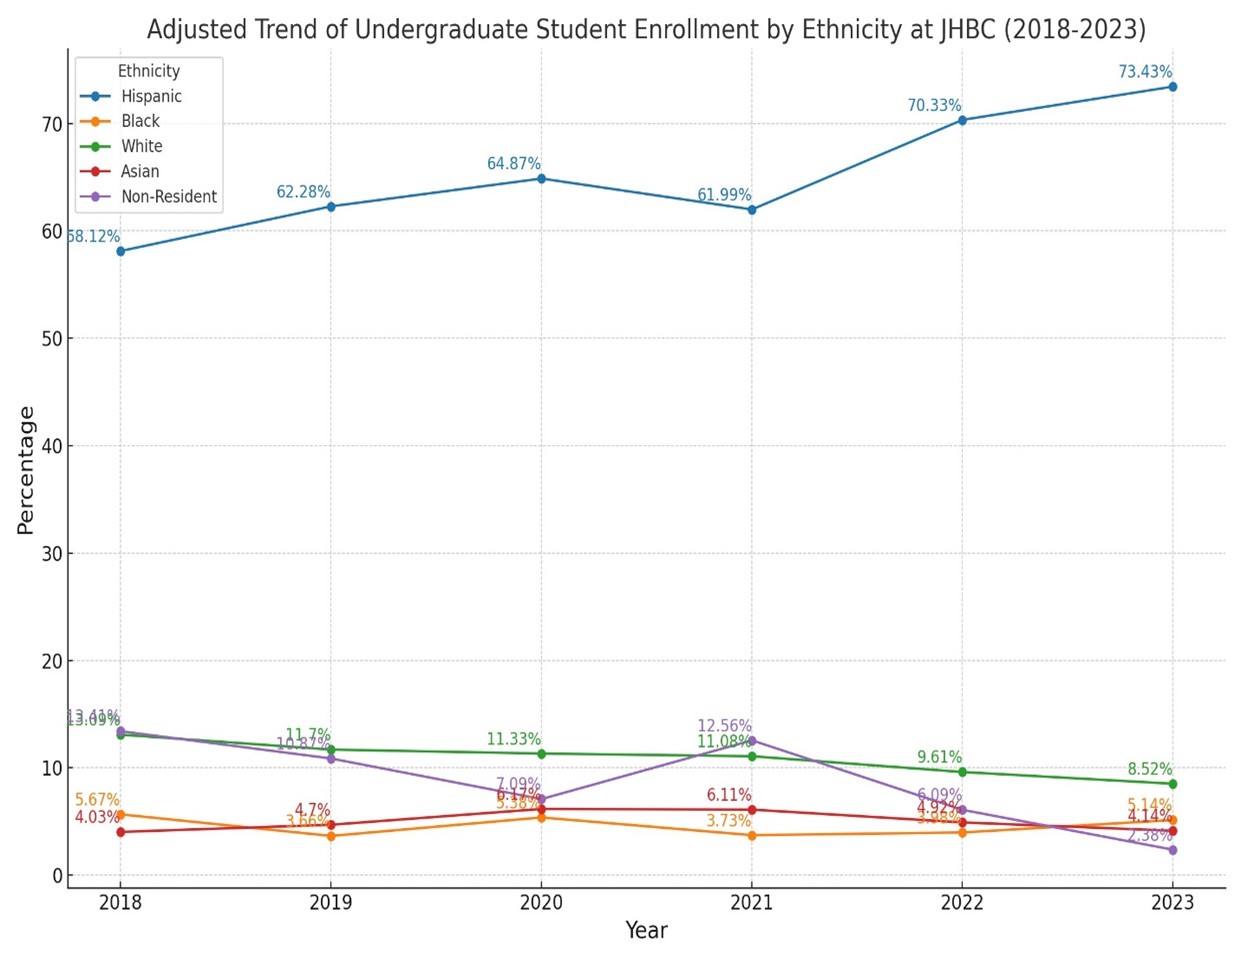
Hispanic or Latino Students: Enrollment of Hispanic or Latino students at CSUSB and JHBC has significantly increased both in percentages and absolute numbers. At CSUSB, the count rose from approximately 67% in 2018 to about 74% by 2023. At JHBC, it increased from about 58% to 73% over the same period.
White Students: There has been a notable decline in the enrollment of White students at both CSUSB and JHBC, with the percentage dropping from 11.6% to about 8.5% at CSUSB, and from 13% to 8.5% at JHBC from 2018 to 2023. The actual number at JHBC felt from 120 in 2018 to 68 in 2023, representing a percentage decrease of 34.7% over five years.
Asian Enrollment: The enrollment of Asian students has seen a slight increase in percentages—from 4.7% to 6.3% at CSUSB and from 4% to nearly 6% at JHBC. However, the actual number at JHBC dropped from a peak of 54 students in 2020 to 33 in 2023. This decrease post-2020 could suggest impacts from COVID-19, possibly due to travel restrictions or other pandemic-related challenges.
Black/African American Enrollment: Enrollment percentages for Black/African American students have remained stable at about 4.5% to 5% at CSUSB and around 5% at JHBC. The actual number at JHBC has decreased from the higher number of 52 in 2018 to 41 in 2023. The reduction could reflect broader enrollment trends or specific recruitment challenges, potentially exacerbated by the COVID-19 pandemic.
Non-Resident Students: The Non-Resident category has experienced a significant decline in both percentages and absolute numbers. At JHBC, the numbers felt from 123 in 2018 to just 19 by 2023, a dramatic decrease of about 84.6%. Particularly between 2021 and 2023, the trend sharply declined, which may correlate with the global impacts of COVID-19, affecting international mobility and visa issuances.
Graduate Enrollment
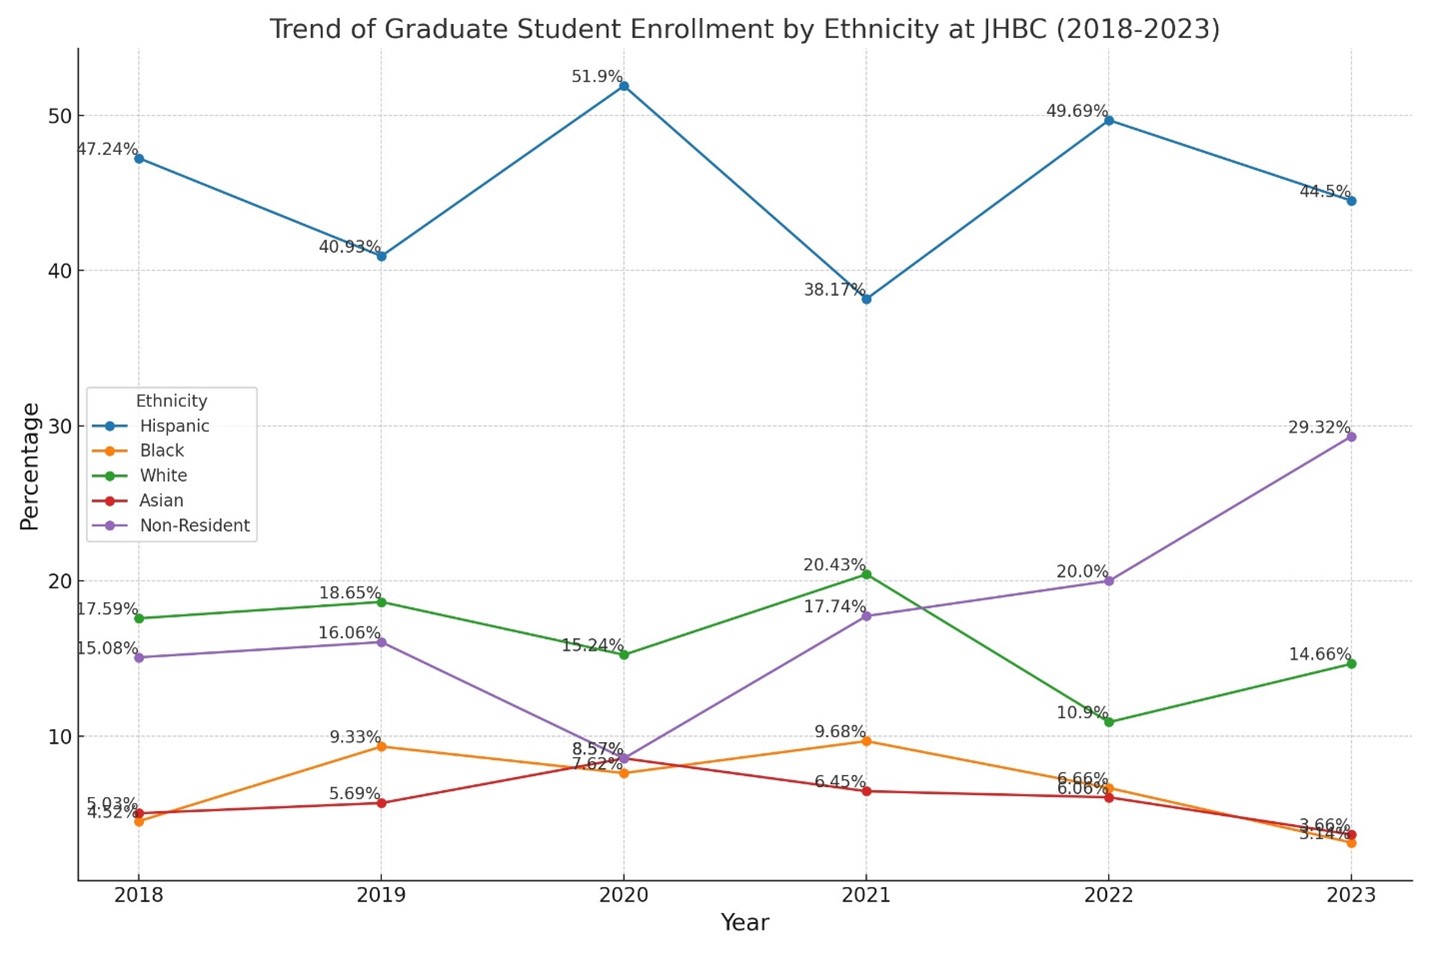
Hispanic or Latino Students: Within the college the percentages started at 47.24% in 2018, the percentage was 44.50% in 2023. After some fluctuations, the overall trend indicates a strong presence of Hispanic or Latino students in the graduate student body. CSUSB showed a similar trajectory, with a slight increase from 47.93% in 2018 to 51.68% in 2023.
White: In the college, there is a decreasing trend of White students from 17.59% in 2018 to 14.66% in 2023. Similar to JHBC, CSUSB reported a decrease from 22.81% to 13.46% over the same period.
Asian: The JHBC trend started at 5.03% in 2018 and reaches a low percentage of 3.66% in 2023. CSUSB reported similar fluctuations with a percentage of 5.29% in 2018 and 4.20% in 2023
Black Enrollment Data for the college showed a significant decrease from 9.33% in Fall 2018 to a low of 3.14% in Fall 2023. This substantial decline highlights a critical area for intervention and targeted diversity enhancement strategies. CSUSB also experienced a decrease, though less sharp, from 6.94% in 2018 to 4.10% in 2023.
Non-Resident Enrollment: In the college, the percentages started at 15.08% in 2018 and increased to 29.32% in 2023. CSUSB also showed an increase from 8.43% in 2018 to 21.63% in 2023.
Implications and Strategies
In summary, the demographic enrollment trends at JHBC within CSUSB reflect a significant commitment to serving the Hispanic community, consistent with our HSI designation and regional demographics. However, it is imperative to address the declining representation of other ethnic groups to foster a truly inclusive educational environment.
Enrollment of Hispanic or Latino reflects our status as an HIS and the area we serve. Conversely, the enrollment of White students is on a decline, mirroring national trends where the percentage dropped from 54% to 51.5% over the same period. For Asian students, while the national average shows a slight increase from 7% to 7.8%, both CSUSB and JHBC have not seen increases. Furthermore, Black/African American student enrollment remains relatively stable nationally, with a slight decrease from 13.5% to about 13.2%. However, both CSUSB and JHBC show percentages well below this national average, indicating an area where the university and the college could focus more effort to increase representation. Lastly, the enrollment of Non-Resident undergraduate students has seen a substantial decline nationally, a trend exacerbated by the COVID-19 pandemic, which affected international travel and visa issuances significantly. Data from CSUSB and JHBC are also on the decline.
JHBC could consider implementing targeted recruitment initiatives to attract more female students, especially in programs where male students predominate. Strategies could include creating mentorship programs that pair prospective female students with current female leaders within the college, offering scholarships specifically for women in underrepresented fields, and hosting workshops and seminars that address the opportunities for women in business fields. To demonstrate its commitment to educating more women, the college should consider investing more in events like the “JHBC OAE ShEconomy”.
The JHBC needs more information about the university broad enrollment strategy, a strategy that must include comprehensive outreach through various media, proactive academic support to ensure all prospective students feel valued and supported, alignment of career services with educational and career goals etc. In 2024, strategic investments in marketing and the efficient use of enrollment management systems are crucial for optimizing recruitment and retention. In 2024, data-driven decision-making is essential to adapt these strategies to changing conditions and improve student outcomes.
JHBC needs to assess the impact of online education thoroughly. The college should explore the advantages of offering flexible learning options and develop programs that align with current job market demands and student preferences. Additionally, it is essential for the college to collaborate with the admissions department to analyze trends in student applications, acceptances, and enrollments. This comprehensive analysis will help identify any disparities or bottlenecks in the admissions process that could be affecting gender ratios. Such insights are crucial for enhancing the effectiveness of recruitment and admission strategies, ensuring they meet the evolving needs of prospective students.
This comprehensive approach addresses the immediate challenges posed by economic and public health crises and positions CSUSB and JHBC to thrive in the evolving educational landscape. Implementing these strategies will create a truly inclusive educational environment where every student, regardless of ethnicity or gender, can succeed and feel an integral part of the academic community.
Retention and Graduation
Undergraduate Retention
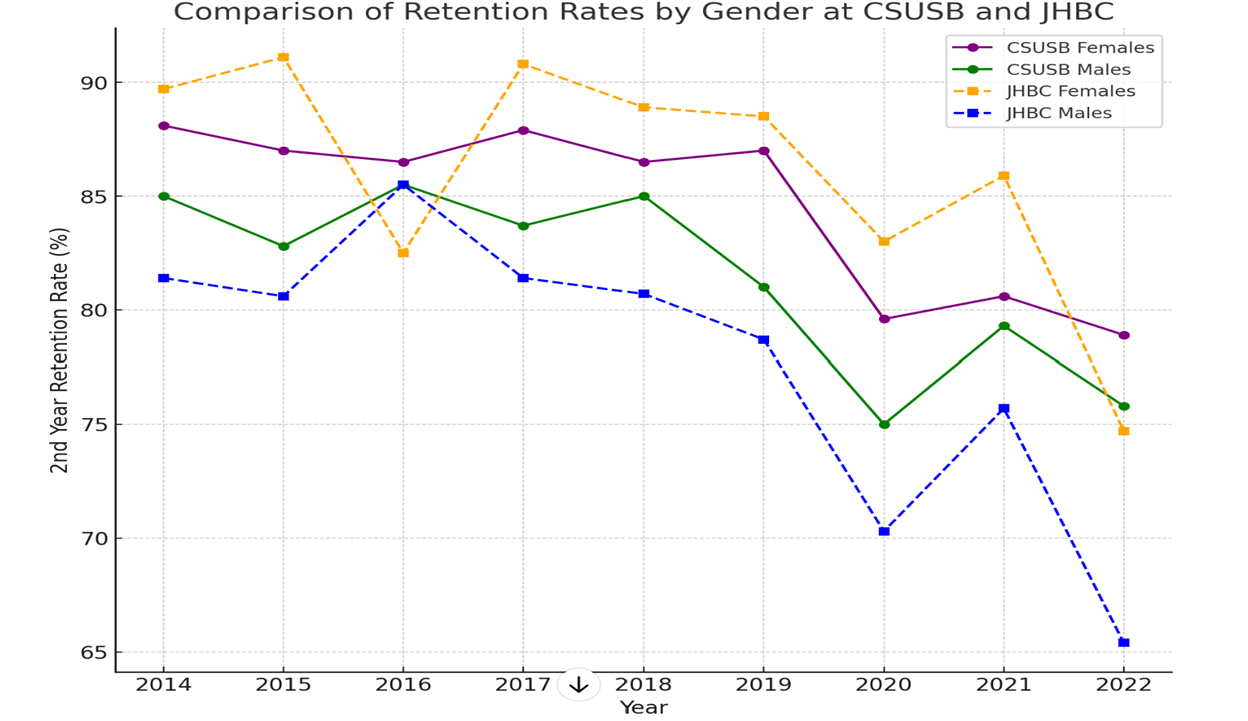
Tinto (1993) as well as the U.S. Department of Education (2020) provide a theoretical and empirical basis for using the 2-year retention rate as a significant indicator of undergraduate student engagement and institutional effectiveness. The 2-year mark is a critical juncture in an undergraduate's academic journey, typically marking the end of the sophomore year. Monitoring retention at this point helps institutions identify and address early issues that may affect student success, such as academic challenges, financial difficulties, or lack of engagement. Additionally, retention rates at the 2-year point can reflect the effectiveness of orientation, advising, and first-year experience programs that are crucial for helping new students transition into college life.
At CSUSB, the 2-year retention rate for undergraduate females decreased from 88.1% in Fall 2014 to 78.9% by Fall 2022, while male students saw a reduction from 85% to 75.8% over the same period, reflecting an approximate 10% decline for both genders. Within the college, the decline in retention rates is even more pronounced. Female students experienced a reduction from 89.7% to 74.7%, and male retention rates plummeted from 81.4% to 65.4%.
The disparity in retention rates between female and male students is more pronounced at JHBC than at CSUSB. In the college, female’s retention rates are now lower than males and females rates within the university. Additionally, the 2-year retention rates for male students at JHBC have shown a concerning decline, falling to just above 65% in 2022. This rate is roughly 10% lower than that of their counterparts at CSUSB, highlighting a significant area of concern for JHBC in terms of male student retention.
Undergraduate Graduation
CSUSB's Graduation Initiative 2025 sets ambitious goals to elevate graduation rates and increase degree completion. Targets include a six-year graduation rate for first-time freshmen of 62%, a four-year rate of 30%, a four-year graduation rate for transfer students of 83%, and a two-year rate for transfer students of 45%.
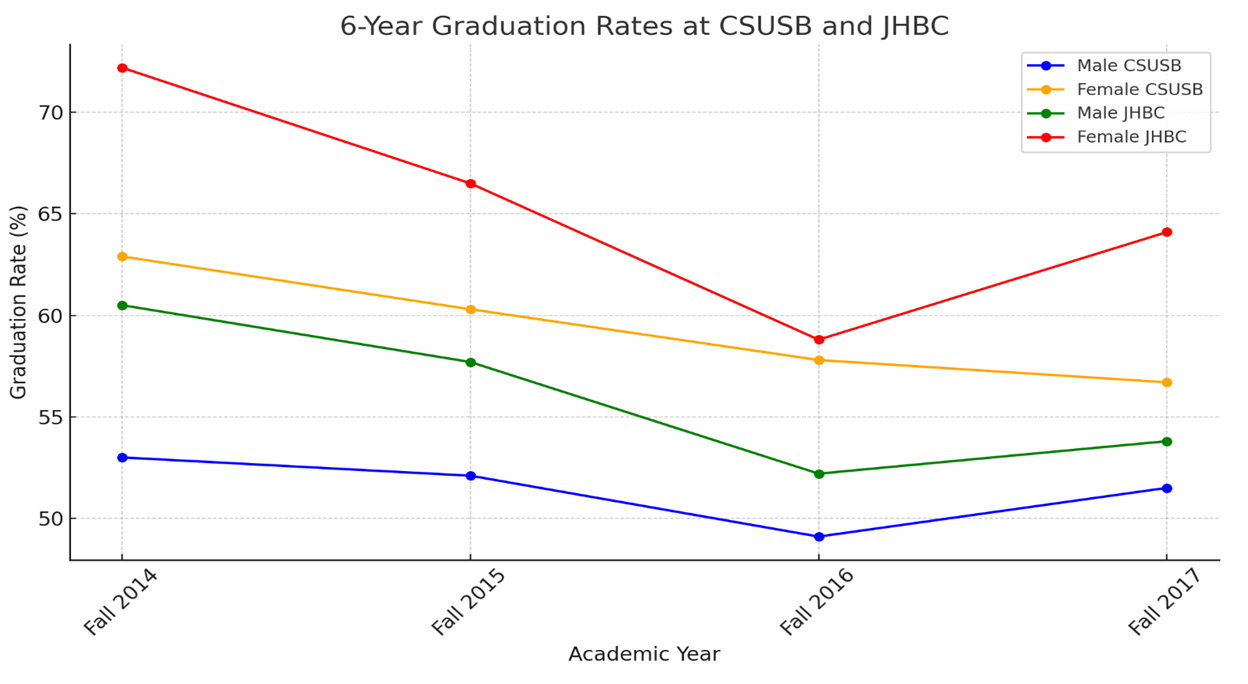
We compare undergraduate graduation rates per gender only due to the limited size of the cohorts when ethnicity is added in the comparisons. We also focus on 6-year graduation rates mostly because it is a common approach in higher education. First the 6-year graduation rate is a widely recognized standard for measuring undergraduate success. It accommodates diverse student backgrounds, including part-time students and those who may delay their studies due to financial, personal, or professional reasons (U.S. Department of Education, 2021). This extended timeline provides a more inclusive and realistic measure of student outcomes across various demographics. Second, a 6-year window allows institutions to assess the full impact of their educational programs, support services, and retention strategies (Seidman, 2012).
Graduation rates at CSUSB show significant gender disparities. Female undergraduates experienced a decline in the 6-year graduation rate from 62.9% in Fall 2014 to 56.7% in Fall 2017, while male undergraduates saw their rates drop from 53% to 51.5% over the same period. Meanwhile, JHBC female students initially surpassed the 2025 target with a 6-year rate of 72.2% in Fall 2014, decreasing to 64.1% by Fall 2017. Male students at JHBC also experienced a decrease from 60.5% to 53.8%. These shifts underscore the need for targeted strategies to enhance male graduation rates and maintain strong outcomes for female students.
Graduate Graduation
The analysis primarily focuses on the 2-year graduation rates for graduate students. The benchmark of 2-yeat is chosen due to the cohort sizes reported by IR and to have a meaningful benchmark for assessing program efficiency. We also only compares gender differences in graduation rates due to the limited size of the cohort when considering ethnicity.
Concentrating on 2-year rates offers several advantages: it establishes a clear expectation for students' time commitment, and facilitates precise resource allocation by ensuring that support services like advising are optimally deployed. Note that a 2-year graduation rate should enhance the attractiveness of programs to prospective students, providing a competitive edge and potentially reducing the financial and time burdens on students (NSCR, 2016 & AERA, 2017).
Within this framework, gender dynamics reveal interesting patterns: while female students at CSUSB did not consistently graduate faster than their male counterparts, the trends varied over the years. For instance, in Fall 2014 and 2015, male students had slightly higher 2-year graduation rates than females (38.2% v 36.6% and 44.2% v 41.8%). However, this trend reversed from 2016 to 2018, with females graduating at higher rates (45.3% v 34%, 42.6% v 39.7% and 47.9% v 46.4%. Yet, in Fall 2019, the rates for females dipped below those of males again (43.1% v 39%). These fluctuations underscore the complexity of gender dynamics in academic achievement within the set two-year period.
At the college, the 2-year graduation trends for male and female students have displayed notable differences over the years. In 2014, 49.4% of male students graduated within two years, surpassing the 45.6% of female students who did the same. This pattern of higher 2-year graduation rates for males continued in 2015, with rates of 48.8% for males and 44.6% for females, and persisted into later years. Specifically, in 2019, the 2-year graduation rate for males was 50.6%, significantly higher than the 30% for females. This trend continued with males graduating at rates of 27.2% in 2020 and 28.6% in 2021, compared to females at 22.4% and 23.5% respectively.
Conversely, the years 2016 and 2017 marked a reversal in this trend. During these periods, females outpaced males in 2-year graduation rates—55.1% for females versus 43.5% for males in 2016, and 53% for females compared to 44.3% for males in 2017.
It's crucial to highlight a significant overall trend: both male and female 2-year graduation rates have decreased substantially in recent years. For males, rates which consistently exceeded 43.5%, dropped to just 27.2% in 2020 and slightly improved to 28.6% in 2021. Similarly, female rates, previously over 44.6% until 2015, dramatically fell to 30% in 2019, then declined further to 22.4% in 2020 and 23.5% in 2021. This sharp decline in 2-year graduation rates underscores the need for in-depth analysis to identify and mitigate the factors contributing to this trend.
Implications and Strategies
The gender gap in retention rates is significantly wider at JHBC than at CSUSB, necessitating focused interventions. Despite longstanding recommendations for initiatives like mentorship programs, peer support groups, and workshops to foster skills development and academic resilience, particularly for male students who have experienced notable declines in retention, implementation at the college level remains slow. It is essential for JHBC to allocate resources so that the Office of Academic Engagement (OAE) can create and pilot these programs, which are crucial for equipping students with the necessary tools for success and personal growth.
JHBC should also tailor its retention programs to reflect its unique student culture and demographics, leveraging resources that exist at the university level. Currently, there is a lack of data on the proportion of JHBC students utilizing these services and their subsequent performance. It is thus crucial for various campus entities to collaborate, providing data and insights that can help JHBC better understand and improve student outcomes. This effort should include strengthening services such as counseling, financial aid advising, and career services, particularly following the recent centralization of advising services. Additionally, community-building events like "The Voice" offered by the JHBC OAE should be adequately supported to foster a strong sense of community.
It is also probably true that JHBC would benefit significantly from increased faculty engagement with students outside traditional classroom settings. By facilitating research opportunities, mentoring, and advising, faculty can greatly enhance student retention and engagement. The effectiveness of onboarding and orientation processes must be evaluated scientifically—understanding who attends these programs, their feedback, and their outcomes is crucial. Without proper data, resources might be allocated inefficiently. Note that increasing faculty engagement is difficult due to faculty teaching load and research obligations to maintain accreditation.
Alumni Affairs partially engages alumni in mentoring and networking opportunities, this effort needs expansion and deeper integration to maximize its impact on current students. Engaging various stakeholders, including students, faculty, and staff, in strategy development is crucial to ensure that initiatives are well-aligned with the real needs of the university community. More robust data on participant outcomes and benefits is needed to assess the effectiveness of these interactions.
A robust system for monitoring and evaluating the effectiveness of new initiatives is critical. Pilot programs should be tested in small groups to gauge their impact before broader implementation. Establishing regular feedback loops and data analysis will allow for the continual refinement and adaptation of strategies, ensuring they remain effective and relevant as educational landscapes evolve.