Student Demographics
Students by Gender
In the modern era, it is well-known that women tend to outnumber men in American colleges, and CSUSB is no exception. This shift can be traced back to the late 1960s when women began to radically alter their expectations for their future careers. Rather than settling for mere jobs, women began to pursue meaningful and fulfilling careers. Experts point to a variety of factors that explain this shift, including the availability of contraceptive pills, the surge of feminism, the premium on college degrees in the labor market, and the rise in divorce rates.
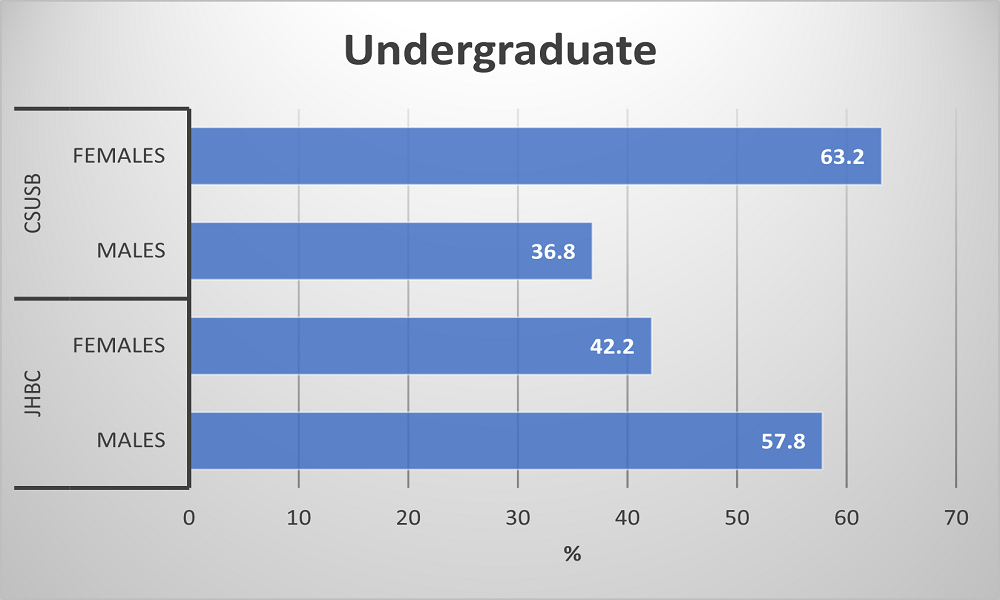
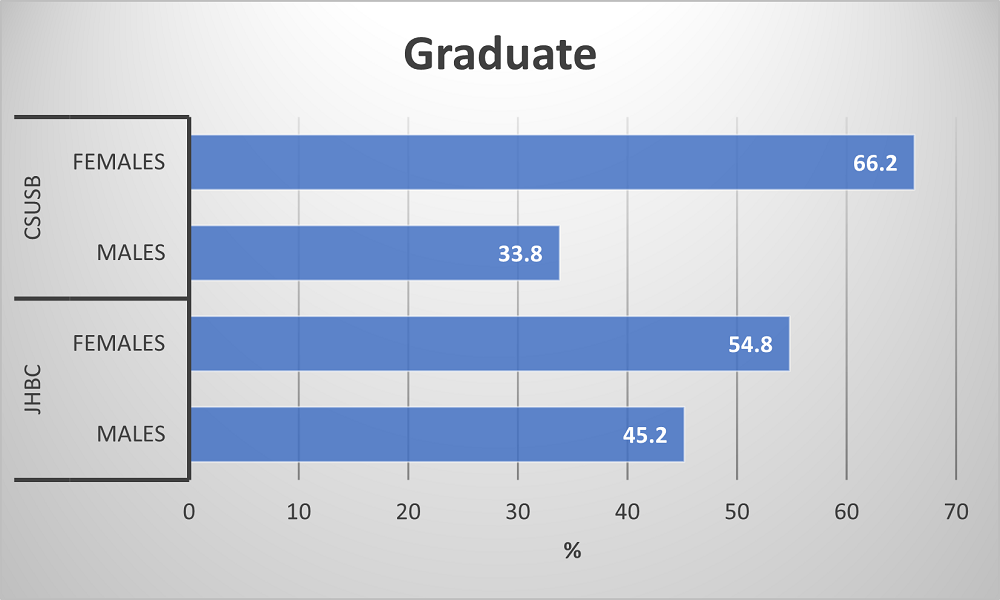
According to Institutional Research (IR) data for the 2021 fall enrollment, CSUSB's demographics are quite similar to those of many other American colleges. Specifically, female students outnumber male students both in the undergraduate and graduate programs. Similarly, at JHBC, the graduate program also boasts a higher proportion of female students than male students, with a male to female ratio of 1.21. However, the situation is different for JHBC's undergraduate program, where male students make up 57.8% of new undergraduate students, and female students comprise only 42.2%.
Undergraduate
Graduate
| Males | Females |
|---|---|
|
511 (57.8%) |
373 (42.2%) |
| Males | Females |
|---|---|
|
1758 (36.78%) |
3021 (63.2%) |
| Males |
Females |
|---|---|
|
84 (45.2%) |
102 (54.8%) |
| Males | Females |
|---|---|
|
233 (33.8%) |
456 (66.2%) |
Students by Ethnicity
The section compares the race/ethnicity of the undergraduate and graduate student populations at CSUSB and in the college (JHBC). Figures 1 and 2 compare the distribution of Hispanic/Latino with other racial/ethnic groups within the undergraduate programs in the college (Fig 1) and the university (Fig 2).
CSUSB and the JHBC are characterized by significant proportions of Hispanic/Latino students in both undergraduate and graduate programs. These high percentages are not surprising since CSUSB has been a Minority Serving Institution (MSI) since 1994.
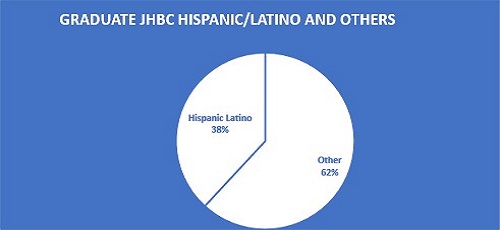
Note that although the percentage of undergraduate Hispanic/Latino reaches 62% in the JHBC (Fig 1) the percentage is slightly higher at the university level (68% _ Fig 2). Also, note that the percentage of Hispanic/Latino graduate students in the college (38% _ Fig 3) is significantly lower than in the university where 50% of graduate students are Hispanic/Latino_Fig 4).
Studies show that Latinx students, especially those who are the first in their families to go to college may not feel that majoring in business is a viable option for them. First-generation Latinx students are more likely to remain undecided than other student groups. These students are also more likely to select majors where they see their peers.
FIGURE 2: Percentages of Undergraduate students at CSUSB: Hispanic/Latino v Others
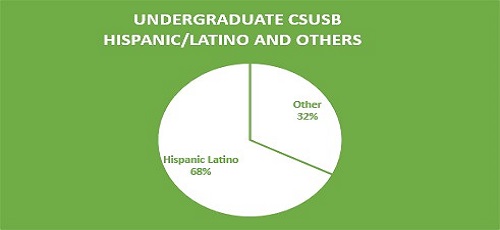
FIGURE 1: Percentages of Undergraduate students in the college: Hispanic/Latino v Others
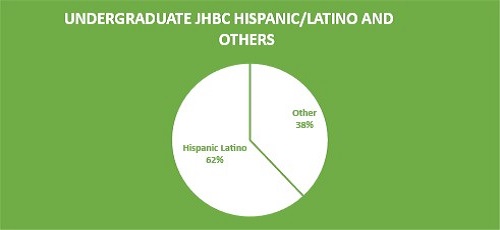
FIGURE 4: Percentages of graduate students at CSUSB: Hispanic/Latino v Others
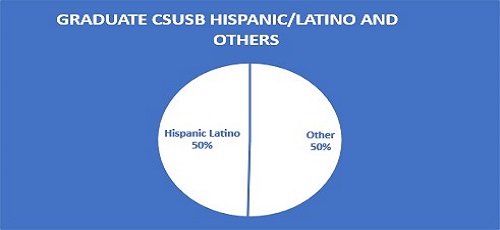
FIGURE 3: Percentages of graduate students in the college: Hispanic/Latino v Others
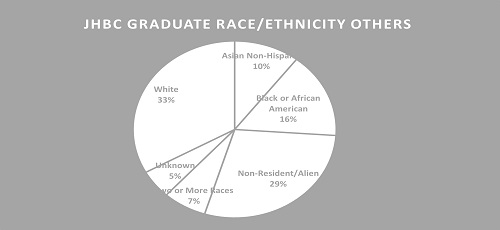
Figures 5 and 6 display the ethnic distribution of undergraduate students in the college and the university. Figures 7 and 8 focus on graduate students. The majority of JHBC's undergraduates are “Non-resident” (33% _ Fig 5). In fact, the percentage of “Non-residents” in the college is twice as high as the percentage within the university. This is not surprising since math, computer science, engineering, and business are the top three majors selected by international students. Figures 7 and 8 show that JHBC's and CSUSB’s graduate student population is very similar. Graduate students are predominantly white while Black and Asian represent about 25% of the student population.
FIGURE 6: Undergraduate Race/Ethnicity distribution in CSUSB
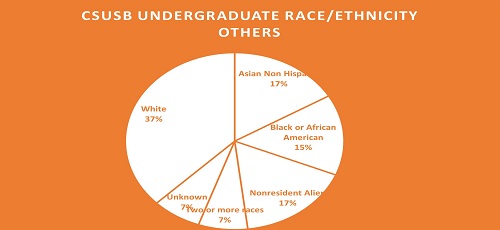
FIGURE 5: Undergraduate Race/Ethnicity distribution in the JHBC
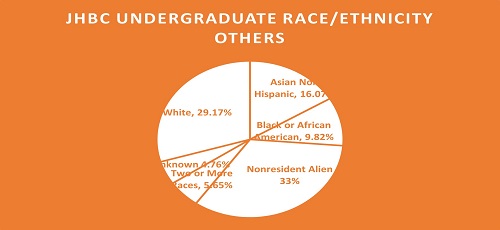
FIGURE 8: Graduate Race/Ethnicity distribution in CSUSB
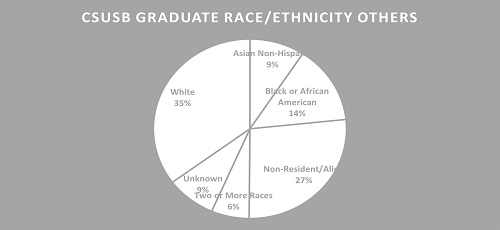
FIGURE 7: Graduate Race/Ethnicity distribution in the JHBC