Student Demographics
Students by Gender
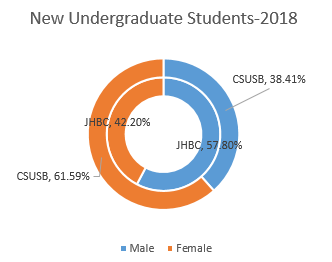
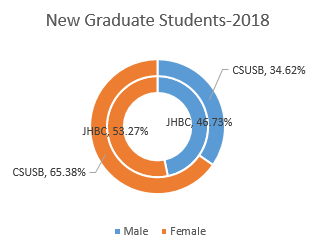
At this stage it is fairly well-known that women today outnumber men in most American colleges. CSUSB is not an exception. The change in the proportion of women vs. men college students can be traced to the late 1960s when women’s expectations for their future career radically changed: “women decide to have careers not just jobs”. Experts mention the availability of the contraceptive 'pill', the surge of feminism, the wage premium for college degrees, and the rise in divorce rates as explanatory factors for these changes. Data from Institutional Research (IR) for the 2018 fall quarter shows that CSUSB demographic matches many other American colleges. When looking at the number of new undergraduate and graduate students, the number of female students at CSUSB is higher than the number of male students at CSUSB. Interestingly, in the college, the numbers new undergraduate male students exceed the numbers of new undergraduate female students (42.2% of the new undergraduates are female). Meanwhile, the number of new graduate female students are slightly higher than the number of new graduate male students (53.7% of the new graduates are female).
Students by Ethnicity
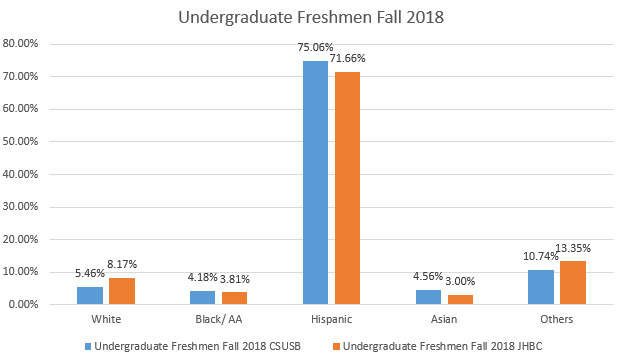
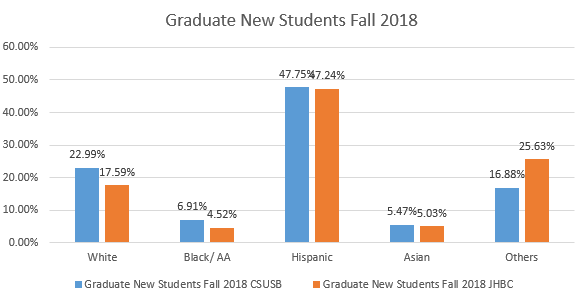
CSUSB is a Hispanic Serving Institution (HSI). HSI’s are defined as colleges, universities, or systems/districts where total Hispanic enrollment is at least 25% of the total enrollment. According to the university IR website, at the university level and at the college level the percentages of Hispanic students reach 75.06% and 71.66%, respectively. When other races are analyzed, the number of white undergraduate students in the Jack H. Brown College of Business and Public Administration (JHBC) is quite higher than the same number at the university level (8.17% vs. 5.46%). The opposite comment can be made for new Black/African American and Asian undergraduate students. For these two ethnic groups, the college percentages are lower than the numbers reported for the university (Black/AA 3.81% vs. 4.18% and Asian 3.00% vs. 4.56%).When new graduates are compared, the percentages of Hispanic students are similar. The University is reporting that 47.75% are Hispanic and the college is reporting that 47.24% of new students belong to the same group. Contrary to what was reported for the undergraduate population, the number of new white graduate students is lower in the college than at the university level (17.59% vs. 22.99%). The numbers of new Black/AA graduate students remain slightly lower in the college than at the University (4.5% vs 6.91%) while the number of Asian is basically the same (5.03% vs. 5.47%). Note that “others” include Indian or Alaska Native, Native Hawaiian, Two or More Races, Unknown and Non-Resident.
Graduation and Retention Rates
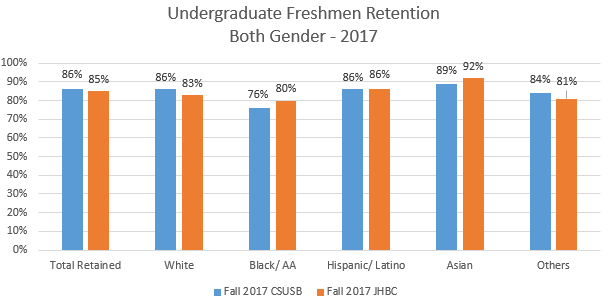
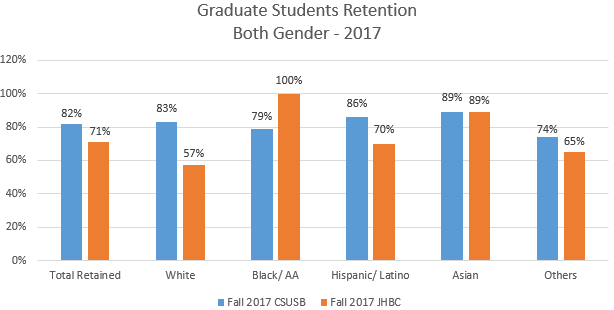
Retention Rates (RR) and Graduation Rates (GR) are often considered to be measures of an institution performance. According to Vincent Tinto (1993), retention shows the “institutional commitment to students. ”RR measures the percentage of students who continue at that the same institution from one year to the next. GR tries to capture the number of undergraduate students who leave with a degree within four years and the number of graduate students who leave with a degree within two years. The JHBC graduation rate for undergraduate students, although lower than expected, is 8% higher than for the University. The GR for graduate students is also higher in the college than in the University. For undergraduate students, RR shows that the University and the college retain similar percentages of students. As far as the college is concerned, these percentages are higher than 80% for all ethnic groups. RR percentages are not as high for college graduate students. Total retained reaches 71% for The JHBC, a number that is 9% lower than for the University. The RR percentages for the various ethnic groups are determined using a very small cohort size. As such these percentages are not interpreted. Source: (Tinto, V. (1993). Leaving College: Rethinking the Causes and Cures of Student Attrition (2nd Edition). Chicago, IL: University of Chicago Press.)
